Translate this page into:
Comparative sonographic evaluation of placental thickness in pregnancy-induced hypertension and normotensive pregnant women in the University of Calabar Teaching Hospital, Calabar, Nigeria

-
Received: ,
Accepted: ,
How to cite this article: Efanga SA, Akintomide AO. Comparative sonographic evaluation of placental thickness in pregnancy-induced hypertension and normotensive pregnant women in the University of Calabar Teaching Hospital, Calabar. Calabar J Health Sci 2020;4(1):1-7.
Abstract
Objectives:
The human placenta is the nourishing reservoir for the sustenance of the fetus and synthesizes a growth-stimulating hormone to enhance proper growth and maturation. The size or thickness of the placenta enlarges as the pregnancy progresses in age to attain a favorable state which can cope with the increasing fetal demands. Placental thickness (PT) is a reflector of fetal well-being, and it is related to fetal weight making it necessary to assess the influence of pregnancy-induced hypertension (PIH), a common pathology in pregnancy, on the placental size or thickness. The main objective of this research is to compare and evaluate the PT and fetal weight in PIH and normotensive pregnant women.
Material and Methods:
The study was a prospective cross-sectional case-controlled study done in the Radiology Department of the University of Calabar Teaching Hospital. During a 12 months study period, 200 singleton pregnant women (consisting of 100 pregnancy-induced hypertensives and 100 normotensive pregnant women) of between 20 and 40 weeks of gestation were enrolled in this study. The two groups were gestational age-matched. The PT was measured trans-abdominally using an ultrasound scan. Pearson’s correlation analysis was used to establish the degree of relationship between PT and other fetal anthropometric and maternal parameters.
Results:
PT was significantly lower in pregnancy-induced hypertensives than in the controls (28.95 ± 5.71 mm vs. 32.31 ± 5.47 mm, P = 0.000). There was a significant negative correlation between the PT and the degree of proteinuria (P = 0.011). Conversely, a significant positive correlation existed between PT and estimated gestational age (P = 0.000) and also estimated fetal weight (EFW) (P = 0.000), in both groups. This same relationship was observed between the body mass index and PT (P = 0.007) as well as the EFW (P = 0.002) in the control group. The mean EFW in pregnancy-induced hypertensives (2.23 ± 1.07 kg) was higher than in the controls (2.13 ± 1.03 kg), but the difference was not significant (P = 0.505).
Conclusion:
There was a reduction in the PT in PIH, which may be due to the appearance of proteinuria when the blood pressure was elevated. However, we did not observe the expected reduction in the EFW due to a reduction in PT, which usually results from proteinuria.
Keywords
Normotensive
Placental thickness
Pregnancy-induced hypertension
Singleton
Ultrasonography

INTRODUCTION
Pregnancy-induced hypertension (PIH) occurs as a direct result of a gravid state. It consists of gestational hypertension, which is defined as a de novo increase of the systolic blood pressure ≥140 mmHg and/or diastolic blood pressure ≥90 mmHg in a pregnant woman of gestational age ≥20 weeks and pre- eclampsia, which is the de novo occurrence of proteinuria ≥300 mg/24 h or ≥30 mg/mmol or ≥2+ on the test strip, in a single urine specimen, in an individual with gestational hypertension.[1-4]
The placenta is a highly vascular fetomaternal organ which maintains the maternal-fetal circulation and fetal nutrition through its connection with the umbilical cord. The elimination of fetal waste products to prevent the accumulation of toxins is also achieved through this connection. Importantly, the placenta produces a growth- stimulating hormone that promotes fetal growth.[5,6]
Placental thickness (PT) increases with fetal age and a normal growing placenta in terms of structure and function produces normal growth and development of the fetus. However, in PIH there is impairment in the development of the placenta, which consequently has a profound negative impact on the PT and, by extension, the fetal development, growth and pregnancy outcomes. The outcome of PIH is initially, the reduction of the placental size and thickness below the normal expected value and, eventually, a reduction in the weight of the fetuses of affected women.[7,8]
PIH with other hypertensive disorders in pregnancy contributes up to 9.1% of the maternal deaths in Africa, 16.1% in developing countries as a whole, 9.1% in Asia, and 25.7% in Latin America and the Caribbean.[9] Between 1991 and 1999, pregnancy-related hypertension caused 15.7% of maternal deaths in the United States.[4,9]
Ultrasonography is a rapid and apparently safe method of evaluating the thickness of the placenta and the fetus.[8] This imaging modality is safe because it utilizes non-ionizing radiation, which is devoid of teratogenic potential in the fetus and maternal cancer induction. Using this modality, the placenta can be seen in its entirety, the point of cord insertion noted, and the thickness (placental) measured.
The aim of this study is to sonographically evaluate the effect of PIH on PT and, subsequently, the fetal weight. We had to measure the body mass index (BMI) to see if it will influence the PT or EFW.
MATERIAL AND METHODS
The study was a 12-month prospective cross-sectional case– control study conducted in the Department of Radiology, University of Calabar Teaching Hospital (UCTH), Nigeria, from November 2015 to October 2016. Ethical approval for the research was obtained from the health research ethics committee of the UCTH, and informed consents were given by the pregnant women through an endorsed document (consent form). Consenting women were administered questionnaires.
The sample size was obtained using the statistical formula of Fischer;[10]
Where
n is sample size
z is standard normal deviate set at 1.96 corresponding to 95% confidence level
p is the prevalence of the hypertension in a previous study which is 6.96%[11]
q = 1-p
d is the degree of accuracy desired which is set at 0.05
Therefore, n = {(1.96)2 × 0.0696 × 0.9304}/{0.05}2
n = 99.51.
Hence, the sample size was approximated to 100 women. Employing a 1:1 ratio, the cases were 100 (hypertensive pregnant women), and the control was 100 (normotensive pregnant women). The two groups were gestational age- matched.
Pregnant women below 40 years of age[12] with singleton gestation between 20 and 40 weeks were referred for this study from the antenatal clinic (ANC) of the Department of Obstetrics and Gynecology, UCTH. A curvilinear transducer operating between 3.5 and 5 MHz connected to a 2 Dimensional Aloka prosound SSD-3500SX fitted with Doppler facility (manufactured in 2008 by Aloka Company limited located in Meerbusch, Germany) was used for the sonographic evaluation of the women.
Exclusion criteria
The followings were the parameters utilized to exclude women with conditions or habits that might affect the natural progression of pregnancy, placental development, and also the growth and well-being of the fetus.
Pregnant women on steroids, anticonvulsant, and anti- neoplastic drugs
Fetal congenital anomaly
Use of illicit drugs (cocaine, heroin, and amphetamine), cigarette smoking, and alcohol consumption
Sickle cell disease and other hematological conditions
Chronic hypertension and hypertension in pregnancy below 20 weeks of gestation
Maternal diabetes mellitus
Gestational diabetes mellitus
Placental anomalies (abruptio placenta, chorioangioma, and velamentous umbilical cord insertion)
Partial molar pregnancy
Leiomyoma uteri
Pregnant women with tuberculosis, HIV or hepatitis
Hydrops fetalis
Pregnancy attained through assisted reproductive technology.
Collection of data
All the women were referred from the ANC between 8 am and 10 am on the four antennal clinic days of the week. On arrival at the Department of Radiology, they were informed about the study, and the procedure was carefully explained to them by the researchers, who also administered the consent form, followed by the signing of the form and filling of the questionnaires. A repeat assessment of the blood pressure was conducted by an experienced nurse.
Clinically diagnosed cases of PIH in the antenatal clinic had a second blood pressure measurement obtained 2 h apart to eliminate errors. The control subjects also had blood pressure measurements taken twice.
Mid-stream urine samples were collected in a sterile universal bottle from all the women in the ANC, and the presence or absence of sugar and protein was determined using a dip-stick.
The height and weight were obtained from each woman to calculate the BMI using Equation 2.
The ultrasound procedures were all performed in the presence of a chaperon by the radiologists. The measured fetal anthropometric parameters (bi-parietal diameter, head circumference, abdominal circumference, and femur length), were utilized to obtain the estimated gestational age (EGA) and estimated fetal weight (EFW). The fetal heart rate was obtained by scanning with the Motion mode of the machine. The PT was obtained using both the B-Mode (Brightness mode) and the color Doppler facility of the machine.
Statistical Package for the Social Sciences Inc., USA for windows version 20.0 was used for data analysis.
PT measurement
The plane of measurement of the PT is a perpendicular line drawn from the point of insertion of the umbilical cord at the chorionic membrane of the placenta to the basal membrane of the placenta [Figure 1]. The PT measurement is done during periods of maternal relaxation and the absence of myometrial contractions.
The placenta is identified as an echogenic structure attached to the myometrium, while the umbilical cord is a tubular anechoic structure that has longitudinal septa separating the umbilical arteries from the umbilical vein. On color flow application, the vessels are identified with red color for the vessels flowing toward the transducer and blue color for the vessels flowing away from the transducer.
RESULTS
The maternal age for all the women in both groups ranged from 15 to 39 years. Most of the participants (70%) were between 25 and 34 years, while the 15–19 year group was the least in frequency, as shown in Figure 2.
Significant statistical differences were observed in the PT, maternal blood pressure, and BMI between the hypertensive and control groups. These were not demonstrated for the EFW and maternal age between the groups. Details are presented in Table 1.
There was a linear increase in the PT with gestational age from the 20th to the 40th in the control group but there were downward trends in the mean value in 7 out of the 20 weeks that were assessed in the hypertensives. These observations are outlined in Table 2.
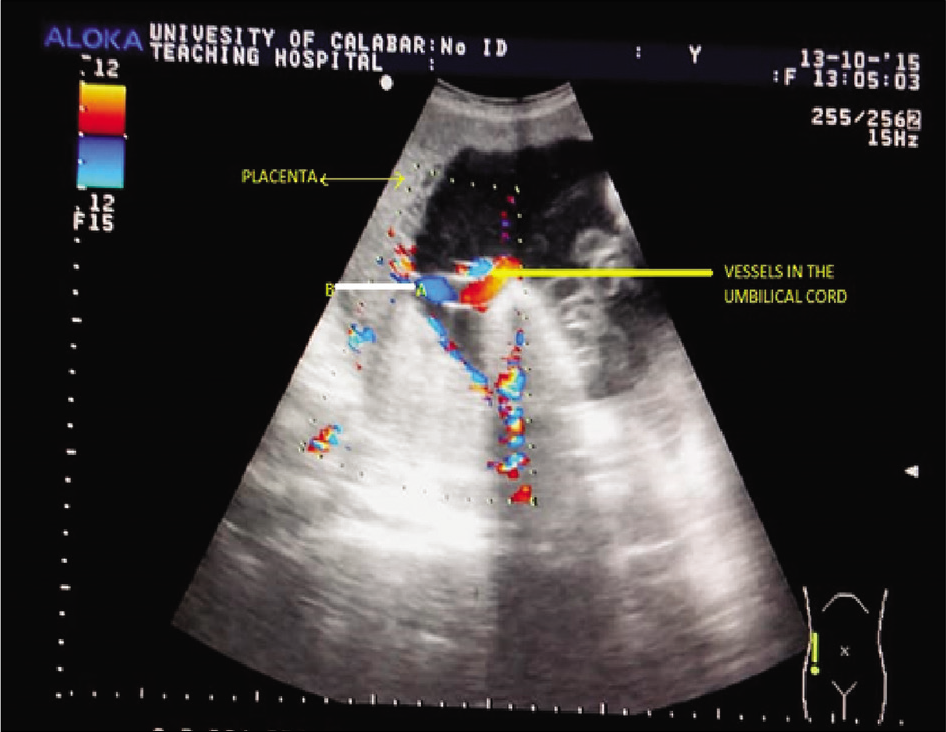
- Color flow Doppler image showing the placental thickness measurement plane. The placental thickness is the distance from A to B, where A = The point of insertion of the umbilical cord at the chorionic surface of the placenta and B = The basal surface of the placenta.

- A bar chart showing the frequency of the different age groups in the hypertensives and the control.
Figure 3 shows the number of PIH cases who did or did not develop proteinuria while having gestational hypertension and to what degree. No proteinuria was observed among the normotensives and 71 of the PIH. Most of the proteinuric had either + or +++ in about the same frequency (n = 10).
There was a significant correlation between PT and the EGA and EFW in both groups (P = 0.000). Furthermore, PT showed significant correlation with proteinuria (P = 0.011) among the hypertensives and with BMI (P = 0.007) in the control [Tables 3 and 4].
Figure 4 demonstrates the changes that occur in the PT as the degree of proteinuria rises.
DISCUSSION
The results obtained in this study demonstrated that the PT of the PIH subjects was significantly reduced when compared to the normotensive pregnant women, but there was no correlation with the maternal systolic or diastolic blood pressure in both groups. It was also observed that the PT in the PIH group had a significant negative correlation with the degree of proteinuria (P = 0.011). The implication of this finding is that elevated blood pressure, irrespective of its severity, was not the direct cause of the PT reduction in the PIH but the appearance of proteinuria. As the degree of proteinuria increases, the PT reduces. Baghel et al.[5] in India had similar findings to this study as they noted that pre- eclampsia resulted in a reduction in PT. However, Afrakhteh et al.[6] in Iran and Miwa et al.[13] in Japan had contrary observations of increased PT in pre-eclampsia and PIH patients, respectively. Their explanation for this was that PIH produced inflammation of the placenta and thus, increase in its thickness.
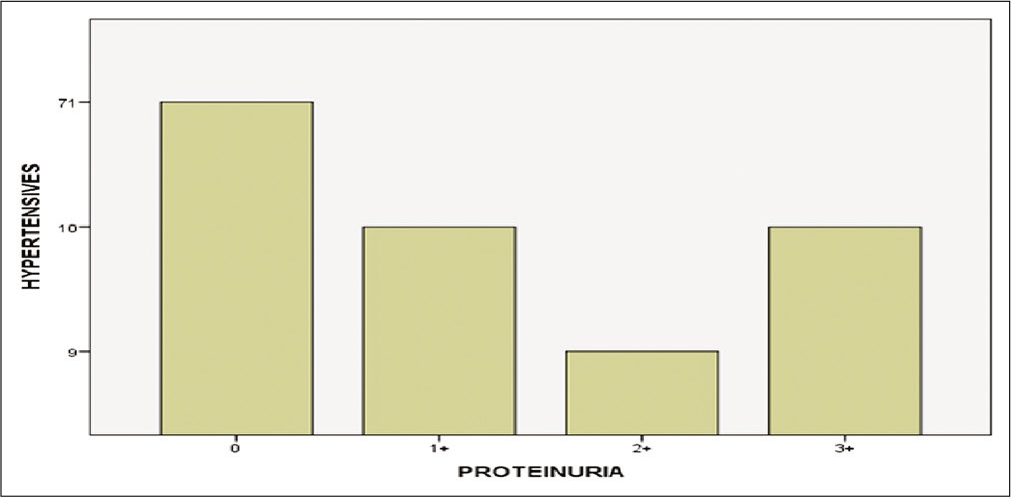
- Frequency distribution of the degree of proteinuria.
| Variables | Hypertensive | Control | t-test | P-value | ||||
|---|---|---|---|---|---|---|---|---|
| Minimum | Maximum | Mean | Minimum | Maximum | Mean | |||
| Placental thickness (mm) | 14.50 | 38.30 | 29.95±5.72 | 19.80 | 39.80 | 32.31±5.47 | -4.253 | 0.000* |
| EFW (kg) | 0.37 | 4.77 | 2.23±1.07 | 0.35 | 4.10 | 2.13±1.03 | +0.667 | 0.505 |
| Systolic BP (mmHg) | 140.00 | 28.00 | 156.83±22.02 | 90.00 | 130.00 | 112.40±8.78 | +18.444 | 0.000* |
| Diastolic BP (mmHg) | 90.00 | 160.00 | 99.68±11.49 | 60.00 | 80.00 | 65.08±6.55 | +26.164 | 0.000* |
| Age (years) | 16.00 | 39.00 | 30.87±5.02 | 19.00 | 39.00 | 29.86±4.32 | +1.525 | 0.129 |
| BMI (kg/m2) | 18.90 | 63.00 | 34.03±6.55 | 20.50 | 39.70 | 29.15±4.21 | +6.262 | 0.000* |
Correlation is significant at P<0.05. EFW: Estimated fetal weight, BP: Blood pressure, BMI: Body mass index
| EGA (weeks) | Hypertensive | Hypertensive | Control | Control |
|---|---|---|---|---|
| EGA | Mean EGA (weeks) | Mean placental thickness (mm) | Mean EGA (weeks) | Mean placental thickness (mm) |
| 20 | 20.43 | 18.00 | 20.00 | 19.80 |
| 21 | 21.18 | 17.63 | 21.36 | 21.20 |
| 22 | 22.79 | 18.75 | 22.05 | 22.17 |
| 23 | 23.43 | 17.10 | 23.07 | 22.50 |
| 24 | 24.48 | 21.56 | 24.26 | 24.08 |
| 25 | 25.36 | 23.40 | 25.43 | 25.75 |
| 26 | 26.47 | 23.63 | 26.50 | 26.13 |
| 27 | 27.33 | 27.33 | 27.52 | 26.93 |
| 29 | 29.57 | 24.45 | 29.50 | 28.85 |
| 30 | 30.50 | 26.42 | 30.47 | 30.00 |
| 31 | 31.37 | 27.76 | 31.29 | 31.04 |
| 32 | 32.43 | 27.85 | 32.36 | 32.36 |
| 33 | 33.48 | 31.27 | 33.52 | 33.27 |
| 34 | 34.26 | 30.70 | 34.36 | 34.23 |
| 35 | 35.27 | 29.97 | 35.06 | 35.12 |
| 36 | 36.47 | 33.37 | 36.36 | 36.06 |
| 37 | 37.38 | 32.48 | 37.38 | 36.93 |
| 38 | 38.59 | 34.80 | 38.43 | 36.97 |
| 39 | 39.25 | 35.48 | 39.21 | 38.80 |
| 40 | 40.22 | 36.65 | 40.14 | 39.60 |
EGA: Estimated gestational age, LMP: Last menstrual period
| Placental thickness (mm) | ||
|---|---|---|
| n | P-value | |
| EGA (weeks) | 100 | 0.000* |
| EFW (kg) | 100 | 0.000* |
| Systolic BP (mmHg) | 100 | 0.061 |
| Diastolic BP (mmHg) | 100 | 0.558 |
| Age (years) | 100 | 0.514 |
| Urinalysis (±proteinuria) | 100 | 0.011* |
| BMI (kg/m2) | 100 | 0.183 |
Correlation is significant at P<0.05. EGA: Estimated gestational age, EFW: Estimated fetal weight, BP: Blood pressure, BMI: Body mass index
| Placental thickness (mm) | |||
|---|---|---|---|
| n | P-value | ||
| EGA (weeks) | 100 | 0.000* | |
| EFW (kg) | 100 | 0.000* | |
| Systolic BP (mmHg) | 100 | 0.118 | |
| Diastolic BP (mmHg) | 100 | 0.777 | |
| Age (years) | 100 | 0.558 | |
| BMI (kg/m2) | 100 | 0.007* | |
Correlation is significant at P<0.05. EGA: Estimated gestational age, EFW: Estimated fetal weight, BP: Blood pressure, BMI: Body mass index

- A bar chart demonstrating the relationship between placental thickness and urinalysis (± proteinuria).
This index study reveals that the degree of proteinuria had a significant negative correlation with EFW (P = 0.047), maternal age (P = 0.027), and parity (P = 0.047) but a very strong positive correlation with the systolic (P = 0.004) and diastolic (P = 0.001) blood pressure. Thus, it can be assumed that when younger women with a lower parity, especially the teen primigravida/nulliparous develop elevated blood pressure in pregnancy, it rapidly leads to proteinuria (pre-eclampsia). Moreover, the increase in the degree of proteinuria has the propensity to reduce the fetal weight in the course of pregnancy and inevitably a low birth weight at delivery.
Peter et al.[4] corroborated the above findings when they observed a significant positive correlation between proteinuria and blood pressure in their study and that pre- eclampsia was more common in first pregnancies. Singh et al.[14] in Sokoto also reported that nulliparous women were at increased risk of having PIH and pre-eclampsia and that women with pre-eclampsia delivered low birth weight babies while normotensive pregnant women and PIH (devoid of proteinuria) delivered normal-weight babies. Yang and Wang[15] had findings that supported this study in their research. Pegu et al.[16] also found that pre-eclampsia was high in primigravid women below 24 years of age among the 200 pre-eclampsia studied.
A significant positive correlation between the PT and EFW was observed in this study in both groups (P = 0.000). Studies carried out by Ohagwu et al.[7] and Karthikeyan et al.[17] in India and Adeyekun and Ikubor[18] also in Nigeria all had similar findings. This clearly demonstrated that any factor which affects the PT will equally have a corresponding effect on the fetal weight.
Although the PT was significantly lower in the PIH cases due to the superimposed proteinuria, the mean fetal weight in the PIH cases was paradoxically higher than the mean fetal weight in the normotensive pregnant women. This could be due to the higher mean value of the BMI in the PIH in relation to its value in the control group. Erika et al.[19] in agreement with this view stated in their Vietnam based study that a low BMI and suboptimal weight gain during pregnancy is recognized as a major factor responsible for the delivery of infants that are small for gestational age. However, Vietnamese women tend to gain less weight when pregnant, so weight gain could actually be race-related.[19] This study reflected the importance of maternal BMI on the ultimate fetal weight on delivery even in the face of the EFW, reducing potentials of pre-eclampsia. In other words, pre- eclampsia in the background of a low BMI (underweight) will greatly reduce the fetal weight more than it would in a pregnant woman that has a normal or high BMI (overweight or obese).[19]
A significant positive correlation existed between BMI, PT, and systolic blood pressure in the control group, but no such relationship was present in the PIH group. Probably in PIH with subsequent development of proteinuria (pre-eclampsia), the relationship between BMI and PT and the systolic blood pressure become altered. Peter et al.,[4] however, demonstrated a significant positive correlation between BMI and hypertension and further observed that a BMI >30 was associated with hypertension in pregnancy. Middendorp et al.[1] corroborated this finding and were of the opinion that an elevated BMI will lead to a rise in the level of serum cholesterol and consequently cause elevation of the blood pressure in affected pregnant women.
The limitations identified in this research included the fact that the gestational age at the onset of hypertension in all the pregnant women could not be ascertained since a reasonable number did not commence ANC before 20 weeks of gestation. Moreover, few women ignore the necessity of routine blood pressure assessment to detect hypertension before conception.
Another limitation is that the research was only carried out in one health facility in Calabar, which will suggest that its findings are only a mirror of what was obtainable where the study was conducted. Furthermore, since it was a cross- sectional study, the evaluation was done once, whereas a longitudinal study could have been a platform to monitor the changes, through serial measurements, in the PT and the fetal weight as the blood pressure and proteinuria varied.
CONCLUSION
Based on the observations in this study, it may be concluded that the PT is lower in pregnancy-induced hypertensives, and this occurs when there is secondary proteinuria superimposed on gestational hypertensives. It is recommended that a study be done exclusively on pregnant women with isolated proteinuria in the absence of PIH, chronic hypertension, UTI, gestational diabetes, and other systemic diseases that can trigger proteinuria. This will afford the opportunity to objectively assess the solitary effect of proteinuria on PT.
A high maternal BMI appears to have a buffering effect on the fetal weight reduction tendency of proteinuria in pregnancy. It is recommended that a study be done involving normotensive pregnant women and proteinuric PIH women who have been BMI matched and gestational age matched, like in the index study, to eliminate the interference of BMI in the analysis.
Acknowledgment
We are extremely grateful to the staff and nurses in the antenatal clinic of obstetric and Gynecology Department and Radiology Department of the UCTH Calabar for their teeming support in aiding the success of this research.
Declaration of patient consent
Institutional Review Board permission obtained for the study.
Financial support and sponsorship
Nil.
Conflicts of interest
There are no conflicts of interest.
References
- Rural and urban differences in blood pressure and pregnancy induced hypertension among women in Ghana. Global Health. 2013;9:59.
- [CrossRef] [PubMed] [Google Scholar]
- Hypertensive disorders of pregnancy: ISSHP classification, diagnosis, and management recommendations for international practice. Hypertension. 2018;72:24-43.
- [CrossRef] [PubMed] [Google Scholar]
- Hypertension in pregnancy: The current state of the art. Rev Port Cardiol. 2012;31:425-32.
- [CrossRef] [PubMed] [Google Scholar]
- Occurrence of pregnancy induced hypertension in selected health facilities in South East Nigeria. Int J Trop Med. 2012;7:86-92.
- [CrossRef] [Google Scholar]
- Correlation of placental thickness estimated by-ultrasonography with gestational age and fetal outcome. Indian J Neonatal Med Res. 2015;3:19-24.
- [Google Scholar]
- Correlation between placental thickness in the second and third trimester and fetal weight. Rev Bras Ginecol Obstet. 2013;35:317-22.
- [CrossRef] [PubMed] [Google Scholar]
- Relationship between placental thickness and growth parameters in normal Nigerian fetuses. World Appl Sci J. 2008;4:864-8.
- [Google Scholar]
- Correlation between placental thickness and estimated fetal weight in Nigerian women. Ibnosina J Med Biomed Sci. 2009;3:80-5.
- [CrossRef] [Google Scholar]
- Pattern of fetal arterial blood flow in selected vessels in patients with pregnancy induced hypertension in Aminu Kano teaching hospital Kano, Nigeria. West Afr J Radiol. 2013;20:9-13.
- [CrossRef] [Google Scholar]
- Biostatistics: A Foundation for Analysis in the Health Sciences (7th ed). New York: Wiley; 1999. p. 180-5, 268-70
- [Google Scholar]
- The Prevalence of Hypertension in Pregnancy among Women in a Rural Northern Community of Nigeria. Vancouver.
- Sex difference and relationships between blood pressure and age among the Ibos of Nigeria. Internet J Biol Anthropol. 2008;3:1-5.
- [CrossRef] [Google Scholar]
- A thick placenta: A predictor of adverse pregnancy outcomes. Springerplus. 2014;3:353.
- [CrossRef] [PubMed] [Google Scholar]
- Hypertensive disorders in pregnancy among pregnant women in a Nigerian teaching hospital. Niger Med J. 2014;55:384-8.
- [CrossRef] [PubMed] [Google Scholar]
- Relationship between acute fetal distress and maternal-placental-fetal circulations in severe pre-eclampsia. Acta Obstet Gynecol Scand. 1995;74:4419-24.
- [CrossRef] [PubMed] [Google Scholar]
- Placental thickness and its correlation to gestational age and foetal growth parameters-a cross sectional ultrasonographic study. J Clin Diagn Res. 2012;6:1732-5.
- [CrossRef] [PubMed] [Google Scholar]
- Relationship between two dimensional ultrasound measurement of placental thickness and estimated fetal weight. Sahel Med J. 2015;18:4-8.
- [CrossRef] [Google Scholar]
- Maternal body mass index and gestational weight gain and their associations with perinatal outcomes in Viet Nam. Bull World Health Organ. 2011;89:81-160.
- [CrossRef] [PubMed] [Google Scholar]