Translate this page into:
Variation in some water quality parameters in vended water from source to consumption: A case of Anguwar Liman area of Samaru-Zaria, Nigeria

-
Received: ,
Accepted: ,
How to cite this article: Ibrahim FB, Ogbozige FJ, Jimoh AM. Variation in some water quality parameters in vended water from source to consumption: A case of Anguwar Liman area of Samaru-Zaria, Nigeria. Calabar J Health Sci 2019;3(2):46-53.
Abstract
Objective:
In recent years, vended water has increasingly become a source of drinking water in most of the urban and rural centers of developing countries due to inadequate piped water supplies. Hence, this study assessed the quality of vended water and its level of contamination at source, during transportation, and at point of use in Unguwar Liman area of Samaru-Zaria during rainy and dry seasons.
Materials and Methods:
This included assessment of physicochemical and bacteriological characteristics and comparing the findings with the World Health Organization (WHO) and Nigerian Standard for Drinking Water Quality (NSDWQ). The water samples were analyzed for color, turbidity, total dissolved solids (TDS), pH, nitrate, phosphate, biological oxygen demand (BOD), and total coliform (TC).
Results:
The color of all the samples was constant at 5 true color unit irrespective of season and point of sampling. However, the mean concentrations or values of the three points assessed for turbidity, TDS, pH, and nitrate during dry and wet seasons were 1.693 and 2.663 nephelometric turbidity unit; 670 and 257 mg/l; 8.3 and 7.3 then 0.105 and 0.178 mg/l, respectively. Similarly, the mean concentrations for phosphate, BOD, and TC during dry and wet seasons were 0.0006 and 0.0068 mg/l; 1.052 and 0.928 mg/l, and 4 and 27 most probable number/100 ml, respectively. The result also revealed that all the physicochemical parameters investigated were within the acceptable limits of the WHO standard and NSDWQ irrespective of the season (except TDS during the wet season), while coliform counts were above the permissible limit during both seasons.
Conclusion:
It was established that the vended water of the study area has better quality during the dry season hence, inhabitants of the study area were advised to disinfect vended water mostly during the rainy season before consumption in other to avoid waterborne diseases.
Keywords
Source
Transportation
Household
Dry season
Rainy season

INTRODUCTION
Water vending is the practice of selling water to household users by water haulers or water facility owners with the exception of bottled and packaged water.[1] Water vending is a common problem in both under-developed and developing countries of the world due to scarcity in the supply of potable water as well as inadequate pipe distribution network from the source to users.[2] Boreholes and hand-dug wells are the major sources of water to the dwellers of the study area (Anguwar Liman area of Samaru-Zaria, Nigeria) being an arid region. However, the high cost involved in drilling boreholes and digging of wells in arid regions, coupled with the absence of perennial streams around the study area made the residents of the study area to encourage water vending. Hence, people take advantage of the inadequacy in water supply to go into water vending as a means of livelihood. Usually, the end-users judge the quality of the water being supplied to them by mere observation of the appearance (color) as well as taste without bothering on other physicochemical and bacteriological parameters. Vended water has been associated with outbreaks of cholera and diarrhea; however, most of the risk of vended water contamination in Nigeria were attributed to the water vendors who retailed the water by jerry cans to individuals after purchasing directly from water facilities.[3,4] Furthermore, it has been reported that water container materials, period of storage as well as storage condition affects the quality of water used at homes.[5]
In Nigeria, the regulatory body for drinking water quality, the National Agency for Food and Drug Administration and Control has not shown concern about certifying and licensing water vendors as they are more concern with bottled and packaged water companies. Hence, it is important to monitor the quality of vended water of the study area from sources to the points of consumption during dry and wet seasons to understand the source(s) of contamination. This is to advise on control measures against contamination that may lead to waterborne diseases.
MATERIALS AND METHODS
Study area
The study area, Anguwan Liman, is a district of Samaru-Zaria, Kaduna state in North-Western Nigeria. The source of borehole is situated on latitude 11°09'46.21"N and longitude 07°38'59.80"E at an altitude of 611 m above mean sea level. It lies between the Zaria – Sokoto road and the Zaria railway line [Figure 1]. The area is further located at about 5.45 km from the Ahmadu Bello University Teaching Hospital, Shika, and 2.52 km from the Nigerian College of Aviation Technology, Zaria.

- Map of Zaria showing source sampling point (Source: Map gallery, geography department, Ahmadu Bello University Zaria).
Geologically, the area belongs to the basement type. Typical lithologic logs show that the upper layer is lateritic (0–10 m) and consists of reddish-brown silty clay and sandy clay with reddish- brown ferruginous concretions. A middle layer underlies at depths of 10–17 m. This layer is composed of greyish brown medium-coarse, gravelly, and pebbly sand highly weathered basement materials. A lower fresh basement underlies the middle layer at depths of 17–55 m. This layer is composed of quartzite and fresh crystalline rocks.[6] The mean annual rainfall can be as high as 2000 mm in wet years and as low as 500 mm in drought years, but with a long-term average of 1000 mm while the mean annual temperature is about 24.5°C.[7]
Sampling and analysis
The source of vended water in the study area was identified; however, the water vendors were interviewed to know if they were regular at fetching water from the identified source. Water samples were collected in sterile sample bottles from the fetching point (source), during transportation (vendors), and at the point of use (household). During each season (dry and wet), the sampling pattern was carried out with different vendors and households at a sampling frequency of 2 weeks for a period of 2 months, making a total of 24 samples for both seasons. The months of January and February were chosen as the sampling period during the dry season, while July and August were selected for the wet season period. These months correspond to the peak of dry and wet seasons in the study area, respectively. Nevertheless, the water quality parameters monitored were color, turbidity, total dissolved solids (TDS), pH, nitrate, phosphate, biological oxygen demand (BOD), and total coliform (TC).
Color, turbidity, TDS, and pH were determined through the use of Lovibond comparator (model S1000), turbidimeter (model HACH 2100N), gravimetric method, and pH meter (model pHep01®, ± 0.1), respectively. On the other hand, nitrate and phosphate were determined through a multi- parameter photometer (model HI83200). BOD was analyzed by Winkler’s method while TC was determined using most probable number technique. Among the parameters analyzed, only pH was determined in situ, while others were determined in the laboratory, in line with standard methods.[8]
The selection of the above-mentioned parameters was guided by past literature on water vending in developing countries.
Statistical analysis
At each sampling point (i.e., source, during transportation, and household), the mean values of each of the analyzed parameters were computed during both seasons. Furthermore, the mean and standard deviation of the source, transportation, and household of all the parameters were calculated and used in determining the coefficient of variation of the parameters from source, through vendors to the household. However, the concentrations of the examined parameters at each of the sampling points during both seasons were presented in multiple bar charts. The charts clearly revealed the trends in contamination of the analyzed parameters from the source (borehole) to the point of consumption (household) through color legends allotted to each season.
RESULTS AND DISCUSSION
The laboratory results obtained at the three points of sampling during both seasons are presented in Table 1.
| Parameter | Mean | SD | CV | WHO | NSDWQ | |||
|---|---|---|---|---|---|---|---|---|
| Dry | Wet | Dry | Wet | Dry | Wet | |||
| Color (TCU) | 5.0 | 5.0 | 0.0 | 0.0 | 0.0 | 0.0 | ≤15 | ≤15 |
| Turbidity (NTU) | 1.7 | 2.7 | 0.0 | 0.0 | 0.0 | 0.0 | ≤5.0 | ≤5.0 |
| TDS (mg/l) | 670 | 257 | 17.8 | 12.8 | 0.0 | 0.0 | - | ≤500 |
| pH | 8.3 | 7.3 | 0.0 | 0.0 | 0.0 | 0.0 | 6.5–8.5 | 6.5–8.5 |
| NO3 (mg/l) | 0.1 | 0.2 | 0.0 | 0.0 | 0.0 | 0.0 | ≤50 | ≤50 |
| PO4 (mg/l) | 0.0 | 0.0 | 0.0 | 0.0 | 0.0 | 0.0 | - | - |
| BOD (mg/l) | 1.1 | 0.9 | 0.2 | 0.2 | 0.1 | 0.2 | ≤1.9 | - |
| TC(MPN/100 ml) | 4 | 27 | 1.7 | 8.3 | 0.5 | 0.3 | 0 | ≤10 |
SD: Standard deviation, CV: Coefficient of variation, WHO: World Health Organization, NSDWQ: Nigerian Standard for Drinking Water Quality, TCU: True color unit, NTU: Nephelometric turbidity unit, TDS: Total dissolved solids, NO3: Nitrate, PO4: Phosphate, BOD: Biochemical oxygen demand, TC: Total coliform, MPN: Most probable number
Color
Consumers of vended water mostly used the color or appearance of the water in ascertaining the fitness of the water for consumption. This is because potable water is supposed to be colorless hence, the perception of many people is that colored water is not fit for consumption even if the water did not contain any toxic substance. In other words, the impact of color is more of esthetic.
Unlike the other parameters examined, the color of the vended water was the same (5 TCU) irrespective of season and point of sampling, as shown in Figure 2.

- Mean color of vended water at each sampling point during both seasons.
Turbidity is a factor known to have influence on the color or appearance of water. However, the present study informed that the color of the water samples was not influenced by turbidity as the water turbidity values were not constant during both seasons unlike color. Hence, the constant value of color recorded could be linked to the accuracy of the device used in determining the color of water samples. Nevertheless, the color of the vended water at each point of sampling during both seasons (5 TCU) is within acceptable limit by the World Health Organization (WHO) and Nigerian Standard for Drinking Water Quality (NSDWQ).
Turbidity
Turbidity measures the scattering and absorbing effect that suspended particles in water have on light. In other words, turbidity measures the clarity or cloudiness of water.
Figure 3 indicates that during each season, the turbidity value of the vended water in all the sampled points remained constant with a value acceptable by WHO and NSDWQ (≤5 NTU). This suggests that turbidity causing materials were not introduced into the vended water in the course of transporting to household.

- Mean turbidity of vended water at each sampling point during both seasons.
However, the turbidity of the water was higher during the wet season. This might be as a result of increased infiltration of recharge water during the wet season, which increased the dissolution of substances that made the groundwater turbid. On the contrary, during the dry season, there was virtually no infiltration of recharge water; hence, most of the dissolved substances settle down, leading to a reduction in the overall turbidity of the water.
TDS
The concentrations of TDS of the water samples during the dry season, as shown in Figure 4, were above the NSDWQ permissible limit (≤500 mg/l) in all the three points of sampling while the reverse is the case during the wet season.

- Mean concentration of total dissolved solids in vended water at each sampling point during both seasons.
The higher concentrations of TDS during the dry season is in line with past literature.[9] This might be attributed to the weathering intensity of rocks in conjunction with less volume of groundwater. Nevertheless, Figure 4 revealed that TDS concentrations at the three points of sampling during both seasons are in the order: Source < during transportation < point of use.
pH
The pH of water is important because many biological activities can occur only within a narrow range; thus any variations beyond an acceptable limit could be fatal to a particular organism. In the present study, the pH of the borehole water (source) during both seasons were within the permissible limits set by WHO and NSDWQ (6.5–6.8), as shown in Figure 5. In addition, the pH of the vended water during transportation and at the point of use was the same as at the source during both seasons. In other words, the vended water been distributed in the study area is safe in terms of pH.

- Mean pH value of vended water at each sampling point during both seasons.
Atmospheric pollutants, mostly oxides of sulfur and nitrogen generated by anthropogenic activities such as burning of fossil fuels (coal, oil, and gas) can cause precipitation to become acidic when converted to sulfuric and nitric acids. Hence, the drop in pH during the wet season could be attributed to the effect of groundwater recharge by acid rain which flows through humic acid in soil. The drop in pH during the wet season agreed with past report.[10]
Nitrate
Consumption of water with nitrate (NO3) concentration above 50 mg/l, the limit set by both WHO and NSDWQ may produce a disease known as methemoglobinemia (blue baby syndrome). Conversely, the concentrations of NO3 in the borehole water that served as the source of vended water were low during the dry and wet seasons. The mean values were 0.105 and 0.178 mg/l, respectively, hence, the NO3 concentration of the source of vended water in the study area is said to be suitable for human health. Before this research, low concentration of NO3 in the the groundwater of Zaria metropolis had been reported.[11] Figure 6 showed that the NO3 content of the vended water did not increase in the course of transportation and at the point of use. This is obvious because nitrate usually gets increased in the water when there is an inflow of nutrient, especially from agricultural runoff, abattoir effluents, failed septic tanks as well as municipal effluents[12] which are not obtainable when transporting water in jerry cans.
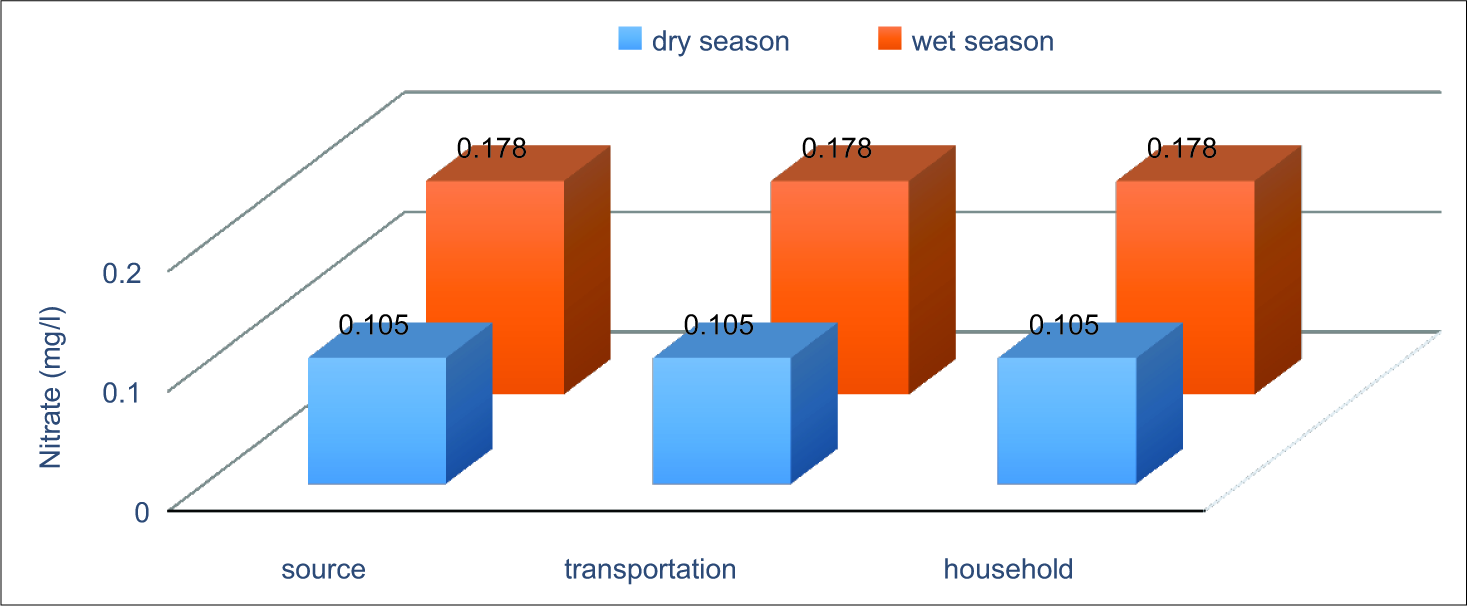
- Mean concentration of nitrate in vended water at each sampling point during both seasons.
Phosphate
The concentrations of phosphate (PO4) in the source of vended water were low, varying between 0.0006 mg/l and 0.00068 mg/l during the dry and wet seasons, respectively. The low concentrations of PO4 at the source suggest that there is absence or little inflow of nutrient into the aquifer. The constant concentrations of PO4 from the source to the point of use, as shown in Figure 7, could be attributed to the same factors responsible for nitrate as earlier explained.

- Mean concentration of phosphate in vended water at each sampling point during both seasons.
Biological oxygen demand
The mean concentrations of biological oxygen demand (BOD) at the source during the dry and wet seasons were 0.9 and 0.7 mg/l, respectively, which are below the maximum permissible limits set by the WHO (≤1.9 mg/l). In other words, the quality of the vended water at the source in terms of BOD was acceptable during both seasons. Figure 8 indicates that there was deterioration in BOD of the vended water in the course of transportation during both seasons. This suggests that the containers (jerry cans) used in conveying the vended water needs thorough and routine washing. The deterioration might as well be as a result of the fact that the 25 L jerry cans used by hawking water vendors during transportation are usually black in color thus, absorbing much solar heating which might have raised the temperature of the transported water.[5] The rise in the water temperature consequently reduced the dissolved oxygen content of the water which in turn raised the BOD content.
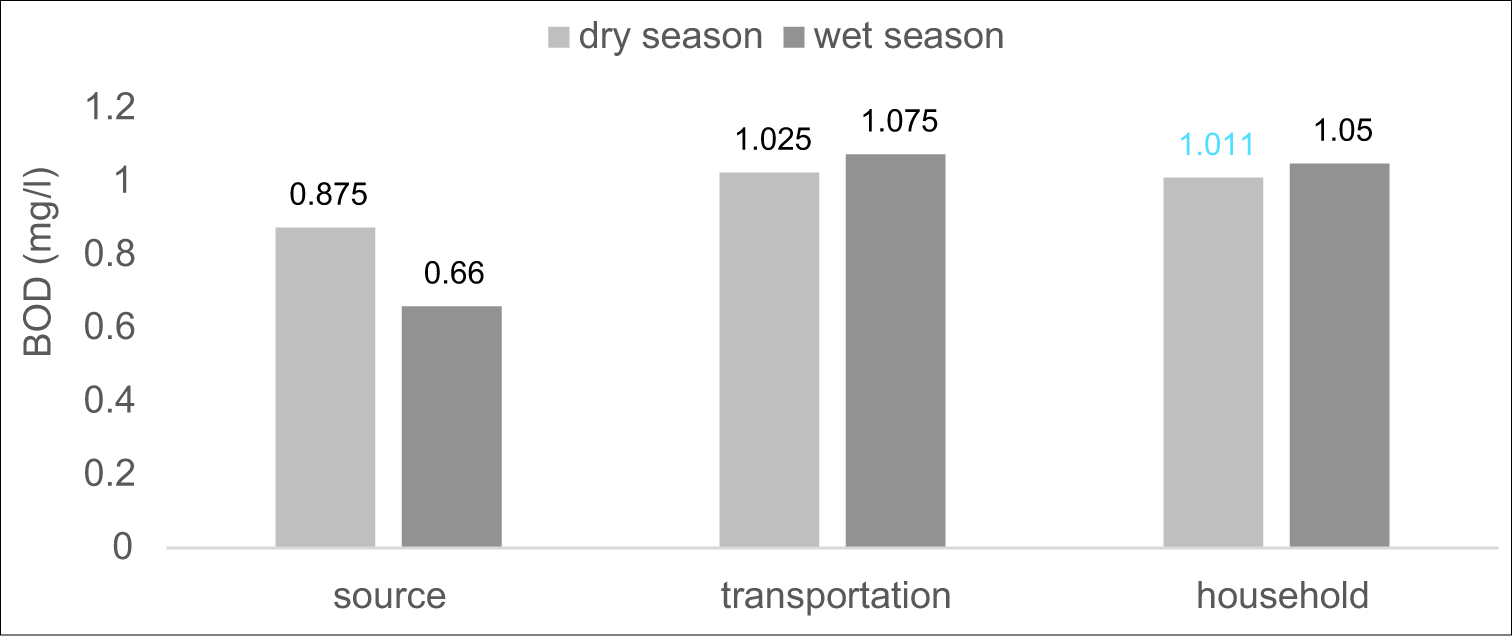
- Mean concentration of biological oxygen demand of vended water at each sampling point during both sessions.
The slight drop in BOD at the point of use or household, compared to the transportation phase during both seasons, could be caused by the oxygenation of the water while pouring from the conveying jerry cans into the storage containers used by household. In general, the BOD content during both seasons at the three points of sampling was within the permissible limit of the WHO.
TC
The bacteriological results of the source of vended water did not comply with the zero counts per 100 ml of both regulatory bodies (WHO and NSDWQ) and this stands as a great health risk to consumers. Figure 9 indicates that the groundwater contamination with coliform was higher during the wet season. This could be attributed to the recharge of groundwater by infiltrated rainfall which might have favored the movement and reproduction of bacteria.
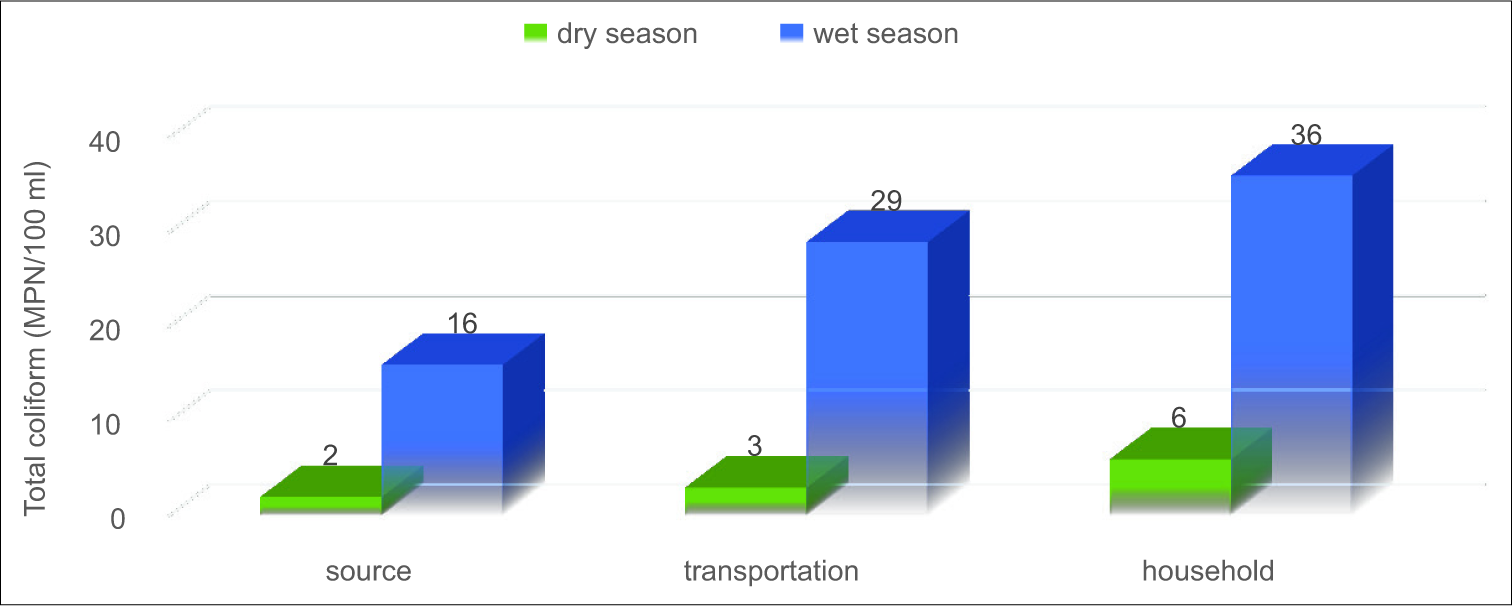
- Mean concentration of total coliform in vended water at each sampling point during both seasons.
It could also be inferred from Figure 9 that the bacteriological quality (TC) of the water deteriorated during the transportation period and got worst at the point of use during both seasons. This might be due to the fact that bacteria proliferate with time once the environment is conducive. In addition, the deterioration during the transportation period as well as at the household suggests that the containers use in conveying as well as storing the vended water needs thorough and routine washing.
CONCLUSION AND RECOMMENDATIONS
Vended water from the study area was found to be of good physicochemical quality as virtually all the physicochemical parameters fell within the permissible standard set by the WHO and NSDWQ (apart from TDS during the wet season). However, vended water in the study area is of poor microbial quality. This is evidenced by the high contamination level of the TC which was beyond the acceptable standard set by the WHO and NSDWQ in all the points of sampling during both seasons. This could enhance the susceptibility of the inhabitants to waterborne diseases.
A comparison of the water quality in the two seasons revealed that the quality of the vended water was better during the dry season, especially the coliform count. Hence, there is a need to enlighten the inhabitants of the study area on the disinfection of vended water mostly during the rainy season before consumption.
Declaration of patient consent
Patient’s consent not required as patients identity is not disclosed or compromised.
Financial support and sponsorship
Nil.
Conflicts of interest
There are no conflicts of interest.
References
- From public pipes to private hands: Water access and distribution in stockholm university, dar es Salaam Tanzania. Water Resour Dev. 2006;16:143-54.
- [CrossRef] [Google Scholar]
- A large cholera outbreak in Kano City, Nigeria: The importance of hand washing with soap and the danger of street-vended water. J Water Health. 2003;1:45-52.
- [CrossRef] [PubMed] [Google Scholar]
- A study of water vending and willingness to pay for water in Onitsha, Nigeria. World Dev. 2009;19:179-98.
- [CrossRef] [Google Scholar]
- Effect of storage time and container material on potable water quality. Ife J Sci Technol. 2018;1:59-71.
- [Google Scholar]
- Using conventional refraction travel time plot to establish the first breaks of refraction events, necessary for tomography inversion in regions with substantial complexity. Elixir Earth Sci. 2017;109:47952-6.
- [Google Scholar]
- Global climatic change and sustainable water management for energy production in the Niger basin of Nigeria. J Earth Environ Sci. 2015;6:4275-83.
- [Google Scholar]
- APHA Standard Methods for Examination of Water and Wastewater. American Public Health Association. In: American Water Works Association (22nd ed). Washington DC: Water Pollution Control Federation; 2012.
- [Google Scholar]
- Seasonal variations of physico-chemical characteristics in water resources quality in western Niger Delta region, Nigeria. J Appl Sci Environ Manage. 2005;9:191-5.
- [Google Scholar]
- Investigation of seasonal variation of groundwater quality in Jimeta-yola area Northeastern Nigeria. Glob J Geol Sci. 2012;10:15-36.
- [Google Scholar]
- Assessment of water quality of hand-dug wells in Zaria LGA of Kaduna state, Nigeria. Int J Eng Sci. 2013;2:1-4.
- [Google Scholar]
- Land use-land cover effects on surface flowing water quality: A statistical approach. Niger J Technol Dev. 2019;16:25-35.
- [CrossRef] [Google Scholar]